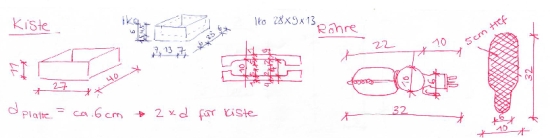
I work with a lot of awesome people. Of course I know that, but every now and then I even get a reminder. While tidying our packing space I found a piece of paper where one of our assistants has carefully constructed a custom box for one of our vacuum tubes. I couldn’t bring myself to just throw it away, I had to share it with all you packing nerds out there:
please accept my apologies that our faithful newsletter informed you about a post that was password protected. This was a mistake, as we are testing our new data logger at the moment and I needed a website to test if we all could have access to our climate dates from all over the world (or, in fact, from all our storages and offices). Didn’t have an idea that this would be sent out via our RSS feed just like any other blog post.
Well, anyway, to keep you in the loop: what is happening at the moment?
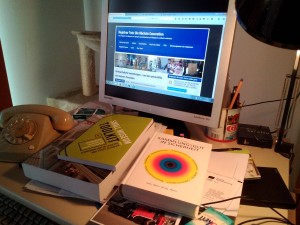
Over Christmas I was experimenting with arduino and other microcontroller boards. Of course, even if I try to do something just for fun, I end up doing something museum related. As I needed something to build, I built a data logger. And if it’s already built, why not take it to work with me?
There it glows… the laboratory at Christmas.
At the moment one little prototype of the “Little Registrar” keeps a good watch over our climate in one of our offsite storages and sends its data to a website. And since this week this other little fellow records the climate in a storage room at our museum and logs it to a SD-Card:
As you see by the q-tip that serves as the restart button this is all in the prototyping stage at the moment. In fact, the “Q-tip Registrar” was a quick answer to an urgency call by our conservators. Assembled with parts I still had at hand, including an old cardboard box, a screw anchor, some ethafoam and, yeah, a q-tip.
Those who follow @RegistrarTrek on twitter know that I promised to write what we did and how and I will do, as soon as we passed the prototyping stage (and stopped creating e-mail bombs).
I hope you enjoyed our little climate mystery. A lot of our readers did and submitted possible solutions. Two people came up with the right solution in this case:
Geert Bellens suspected immediately that the logger was brought into another room and was right about this place:
”If someone was breathing close to the logger, the temperature would rise at 16:30, but humidity also. If a heat source was involved (local heater, lamp,..) I would expect rising temperatures, and lower humidity, but no that drastically.
I would think someone took the datalogger to another room (warmer, dryer) and then maybe outside in the car for a night, to put it back the 3th September…?”
And Michael Hall did a complete analysis that was accurate to the point:
”I would suggest that the logger was actually removed from it’s original location. The changes in humidity are being driven by the changes in temperature. Looking at the conditions before and after the fluctuations the conditions are fairly stable. The sudden change in temperature could be caused by someone accidentally putting the logger into their bag that has come from a warmer environment, walked out of the building allowing the temperature to cool, then got in a car,driven home with the air con on, got home at about 17:30, the car is left in the evening sunlight allowing the car to warm up before the sun disappears giving a gradual cool down overnight. At 07:30 next morning, the person drives into work, realises they have taken the logger home and puts it back in situ.“
Although those were the right solutions in our case, there were other solutions that are well worth considering when YOUR logger shows an odd graph like ours:
Christian Baars: “The weather was mild during early September 2013, with daytime temperature at around 24 deg C. However, your T changes are too rapid to be caused by normal daily fluctuations. The RH changes in this case are counter correlated with your T changes, which suggests that something affected T but confirms you have no independent RH control. As you say there is no HVAC an equipment malfunction can be excluded. Something lead to the steady then rapid T increase, then slow drop during the night, followed by rapid normalisation of conditions. Do you have central heating in the building which came on, the store got too warm, someone opened a window in the evening of the 2nd which was left open over night then closed in the morning of the 3rd?”
Kathy Karkut: ”Potentially something was dropped over the data logger such as a box or bubble pack, etc. and the readings are for a very small contained space surrounding the DL. The next time someone was near the DL they removed the covering.“
Chris Au: ”My first avenue of inquiry would be to confirm the integrity of the datalogger; was the data compromised in its collection, interpretation, storage or transmission?
Secondly, was there any other evidence of the T and RH fluctuation?
Thirdly, what are the items in storage? Could anything there be a cause?
Perhaps there would be clues in those answers.“
Hugh Glover: ”A staff member did something dry as they left for home and undid it when they arrived in the morning; not sure what they did though!”
Paul McAuley: ”I agree with Kathy Karkut, something has fallen over the datalogger unit creating a microclimate – a sheet of bubble wrap or tissue – or some creature has interfered with the sensor – or maybe there is a ghost in the machine…”
Pat: ”There was marked solar flare activity from Sept 1 to Sept 3 2013. Could that have had anything to do with disrupting the datalogger readings?“
The most interesting alternative solution, and something I really hadn’t thought about so far came from Doug Nishimura. We take it for granted that we – or the building and our technical appliances – control the climate conditions. However, sometimes it’s the other way round. The objects control the climate:
”I was going to comment that the places where temperature and relative humidity go up or down together (at least briefly) looks like the objects controlling the conditions. We’ve seen this in a historic house in which the attic went up and down in temperature with day and night. In the day, temperature would rise accompanied sometimes by a small dip in RH followed by a sharp rise in RH before plunging. As temperature peaked and started dropping, we might see a little upward spike in RH but followed by a sharp drop in RH as temperature fell before rising back up. This was the wood in the attic releasing water vapor as temperature went up (off-setting the expected drop in RH as temperature rose) and the adsorption of water back into the wood as the temperature fell again. We more recently ran into in a warehouse full of ceramic pottery pieces from archaeological digs. The clay was also adsorbing water as temperature went down and releasing as the pottery pieces warmed up.
I’ve included a pdf slide of on an experiment my colleague, Jean-Louis, did with sensors in a box of matted photographs. He actually had a sensor inside the stack, inside the box on top of, or beside the stack and outside the box. The large arrows point out the first points that show the effect of the material on the RH inside the box. So you see as the temperature goes up, the humidity sharply follows it up before talking a long slower slide towards equilibrium. When the temperature goes down, we get a sharp drop in RH followed by the long slow slide towards equilibrium. As we poked into data that people uploaded to eClimateNotebook, we noticed this pattern appearing surprisingly often and we figured out that if you start from an empty room with non-hygroscopic walls, the environment is what it is. We start adding objects into the room and the room controls the objects. Eventually you reach a point where the ratio of hygroscopic materials to free air in the room is just high enough that the objects start to control the room. We don’t really see it so much in temperature, although I point out that a ream of common office copy paper (and American copy paper is 8.5 X 11 inches or 215.9 mm X 279.4 mm and one ream is 5 pounds or 2268 grams) takes the same amount of heat in or out to change one Celsius degree as 3.64 cubic meters of dry air. Possibly the effect doesn’t show-up because of the slow thermal conductivity of paper, but it’s an example of what can happen.“
It wasn’t a trouser pocket, but it was the right lead. What we got here was definitely a people pattern. A storage area of the size at hand can’t change humidity by 20 % within 10 minutes if it is not to really catastrophic circumstances. It couldn’t be something that happened in the storage, it was something that happened to the logger.
Here’s the whole story:
The data from our data loggers is downloaded to a laptop at the beginning of each month, preferably on the first day of a month. September 1, 2013 was a Sunday, so September 2nd was the date for collecting the data.
On September 2nd about half past four p.m. our conservator responsible for the loggers called me to say that he just couldn’t make it to download the data on this day. But as we had a staff meeting on the next day and I was already at the offsite storage now, he asked if I could simply fetch the logger and bring it to the museum the next day.
Well, of course I could. I immediately took the logger and put it in my car so I wouldn’t forget it at closing time. While I was finishing my work at the offsite storage you can see how the poor logger lies in my car that was parked in the bright sun. About 20 minutes later I closed the storage and hit the road. As it was hot in the car, I rolled down the windows, resulting in a temperature decrease to a pleasant 25 °C (77 °F). At half past five I parked my car at home, again in the bright sun of a lovely, mild September evening. It was one of those last warm September evenings, where you can sit in front of the house with a cool drink and enjoy the warm rays of the setting sun. Apparently, it was far less pleasant inside of the car, hitting 30 °C (86 °F).
The next morning I got back into my car which had cooled down to 13 °C (55,4 °F) during the night. I was freezing, so I turned on the heating. When I found a parking lot in front of our museum at 8:10 the car was quite comfortably warm at 22,5 °C (72,5 °F). I took the logger and brought it to our conservator, so from now on the logger logged the regulated climate inside of our museum.
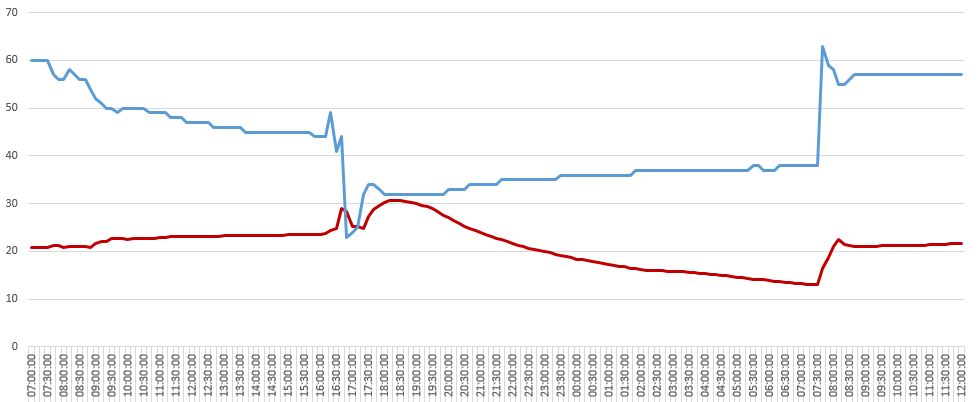
I had a look at the graph. It looked like a pretty normal day in this area until about 16:40. We have a slow increase in temperature from about 21 degrees to 25 degrees Celsius (69,8 to 77 degrees Fahrenheit) and a drop in humidity from 60% to under 50%. Nothing odd for this less-than-ideal hall in the changing season of a German autumn. If you take a look at the weather dates of said day from the nearby weather station you can see that our inside correspondents with the outside: http://archiv.mannheim-wetter.info/2013/pcws/20130902.gif (thick green line for temperature, thin purple line for humidity).
Then, after 16:40 things got odd. We see a sudden increase in temperature up to 29 °C (84 °F) and a drop from 44% to 23% within only 10 minutes. If this weren’t odd enough, only 20 minutes later we see the temperature dropping back again to 25 °C (77 °F) and humidity slowly increasing to 32%. At 17:30 we see again an increase in temperature, climbing up to over 30 °C (86 °F) and staying as high until 19:00 to slowly, slowly start decreasing over the next few hours, reaching 13 °C (55,4 °F) at half past seven the next morning. Then, suddenly, the temperature increases, again in an unusual way, reaching 16 °C (60,8 °F) at 7:40, nearly 19 °C (66,2 °F) at 7:50, peaking to 22,5 °C (72,5 °F) at 8:10 to become quite stable again at 21 °C (69,8) and 57% relative humidity.
Again and again I looked at the data and discussed it with colleagues. Then, a colleague mumbled “Looks like trouser pocket.”
Suddenly I could see the whole story when looking at the graph. Can you?
I received a call from our conservation trainee. She was in the process of analyzing the climate from one of our offsite storage areas for 2013 and discovered something really, really odd. She sent me the data and asked if I could make sense of what happened on September 2 and 3 in the said year. Please see the graph below, showing the temperature in degrees Celsius (red line) and relative humidity in percentage (blue line) between September 2, 7 a.m. and noon on September 3. Can you make sense of what you see?
The data logger is a portable digital logger powered by batteries in the middle of a large storage area without HVAC that is approximately 2,000 square meters (about 21,500 square feet) and 5 meters (16.4 feet) high. In the next part we will discuss the graph and I will tell you the hint from a colleague that finally brought the solution.
This may seem a weird way to start an article written for registrars, but many years ago, I attended a day of clown school. It was a pretty unique experience, and (little did I know at the time) it was also an experience would turn out to have something in common with working as a registrar! Be you clown or registrar, the art of juggling is an important part of the job. For a registrar working with loans, for example, juggling is required to ensure that the demands of both the lender and their institution are satisfied to a standard that will enable the loan to proceed. When it comes to university museums, however, there is a whole extra level of complexity to these loan negotiations. University museums commonly undertake intra-institutional loans to all sorts of locations around their own university. Your items may still be ‘on-site’, but how much influence can you actually maintain over your loans in these circumstances? Juggling balls can all too quickly become chainsaws when you realise that there are many competing demands to manage in this environment, some of which are out of your control. The requirements of collections care and preservation, for example, can struggle to make themselves heard against the demands of institutional expectations, history and politics. Where do you draw the line on loan requirements in these circumstances? Is there, in fact, a line? Or is it a tightrope, perhaps? This was the very interesting subject which formed the basis for a fascinating session on the morning of Day 2 of the 2015 ARCS Conference in New Orleans.
ARCS 2015: Session on On-Campus Loans (picture by Greg Hunter)The session included presentations from three different speakers. Nicole Linderman from Harvard Art Museums, Trevor Weight from Brigham Young University (BYU), and Sonja Reid from the University of Texas (UT) all spoke to us about the challenges of loans within their university. Nicole kicked things off by putting on her metaphorical Stetson to take us through the ‘Wild West’ of campus loans, outlining circumstances which were subsequently shown to be similarly evident at all three institutions. All of the speakers indicated that collection care had taken a back seat in many cases at their universities. At Harvard, tradition was seen as substantially more important than collection care, as evident in the fact that many of the institution’s works had been displayed in a particular location since time immemorial and consideration had never been given to potential display change or object preservation. In addition, many new loans were still occurring despite an object movement related moratorium being in place, underlining the disregard being given to collection care. At BYU, loan agreements were often disregarded to such an extent that people who had objects on display in their offices/halls would consider the objects to be ‘theirs’, and would often take them with them when they moved offices or even take them home! UT noted a problem common to all three institutions in that loan agreements for collection items were being made with people within the institution who were not museum trained, meaning that they did not understand the purpose of loan agreements and often did not see the necessity of following them.
In all three locations, then, something needed to be done to remedy the situation. As Trevor put it, the approach needed to be a three step process – Change It, Sell It and Enforce It. In each case, change meant the development of a robust new loans policy. The emphasis was on policy rather than comprehensive loan agreements because of the internal nature of the loans and the lack of expertise held by those borrowing the works. Good polices, therefore, needed to be developed and key university figures needed to be convinced of the usefulness such policies in order for them to succeed.
The universities in question all had similar ideas, but there were differences in their approaches to change due to their different circumstances. At Harvard, a yearly contract document was implemented for loans – previously, many loans had not been documented at all. At UT, loan agreements for such loans were actually decommissioned as they simply weren’t enforceable. University policy dictated that one campus entity could not sue another even if such an agreement was breached, meaning their usefulness was very limited.
A very important factor in instituting change at all three universities was education. This was what Trevor called ‘selling it’ – if people better understood the need for such policies, they would be more likely to follow them. What better place to learn than a university, after all? At Harvard, Nicole took the opportunities presented by a physical inventory of the collection to personally meet and talk to numerous stakeholders to discuss the new policy. It’s not always easy to get the ear of important people, but accessing their private office to look at artworks can provide you with great opportunities! Nicole used this chance to the utmost, educating stakeholders about the importance of shade, air conditioning and other associated factors to the preservation of the artwork while undertaking her inventory. Trevor also started his revolution by explaining the situation to borrowers. As part of this, Trevor offered anyone willing to do so the chance to replace their display items with prints, which could be of any object in the collection. This was what Trevor called a ‘game changer’, as it gave borrowers a great incentive to implement change by offering them much greater choice. At UT, the new loan policy is still in draft form, but Sonja has flagged the need for a personal review of the loan policy with each borrower in order to ensure they are fully aware of their responsibilities at all stages of the loan – before, during, and after.
Both Nicole and Trevor reported that results have been encouraging since the implementation of their new policy. Nicole’s comprehensive new policy, which covers loan approval processes, installation, annual contracts and reviews, facility reports, inventory, light sensitivity, security, glazing, hardware, and even the recall of works, has gained significant acceptance within Harvard. At BYU, the situation has greatly approved. The requirements of collections care are much more widely acknowledged, and BYU’s print program has meant that the number of original artworks in display has significantly reduced. The success of BYU’s new approach was illustrated by the example of no less than the university president, who declined the return of a painting to his office after it had been on loan elsewhere and kept a print on display instead. If the new policy at UT is approved, Sonja is hopeful that her university will be similar results.
All three speakers did a great job at showing us just what a good registrar can do. Confronted with very difficult situations in which to manage the care of their collections, Nicole, Trevor and Sonja have all made enormous strides in helping to ensure that their collections are well cared for and preserved for many years to come. It was inspiring stuff to hear, and I was so glad I was able to be there to hear it. Chainsaw juggling? That’s nothing – give me university juggling any day!
Greg Hunteris the Registrar of the National Sports Museum at the Melbourne Cricket Club in Melbourne, Australia. He is a member of both the Australasian Registrars Committee (ARC) and the Association of Registrars and Collections Specialists (ARCS), and received a travel stipend to attend the 2015 ARCS Conference. He loves learning about museums, and enjoys reading, writing, and playing guitar in his spare time, though ‘playing’ is perhaps a very generous description of his attempts in that particular field.
Was it already a year ago we raised our glasses to celebrate the second birthday of our project? Time passes so quickly! It’s been a turbulent and busy year, I guess for all of us. For me as the administrator it was especially packed: in my day job as the collections manager of the TECHNOSEUM there was much to do with managing taking over a large collection of broadcasting equipment and finding space for it in an already crowded storage area. At night and on the weekends I was busy writing about managing unmanaged collections. One of my cats was hit by a car and badly injured but fortunately is recovering and nearly back to normal. Of course, the departure of Derek as an author was a big loss, too. Well, this is a weak try to apologize for not being as active as in previous years in finding new contributors and topics for this project. I hope in 2016 I will have more time again to keep watching our profession and dig out more stories.
Anyway, we had some great stories: the most read post with the most active contributors was “How NOT to number objects“. We had many readers asking to have a follow-up on current best practice in object marking. If someone feels like writing something about that, even if it is just for one group of objects, this would be a great new series, helping people who are unsure, especially after this post! Nearly as popular was the post “Put a lid on it” by Anne T. Lane and the real-world examination of the damage light does on post-it notes by Judith Haemmerle. We saw some great new books being published, the forth edition of Basic Condition Reporting, Nomenclature 4.0 and The Rights and Reproductions Handbook were presented here. We also started a new series, “Failures in Figures“.
Will write something about this, soon.The topic of unmanaged collections was strong this year and even when the book is published I want to keep it as a focus, because I think those stories from the trenches really help those struggling with their own collections. The European Registrars Conference is in Vienna this year (Yay to our colleagues from the Austrian Registrars Committee!) And I hope I will be able to attend and write a report. There are still some promised reports from ARCS in New Orleans, hopefully coming soon!
As more and more of our readers coming here with mobile devices I hope I will find the time to adapt our layout to be more mobile friendly or find alternative solutions for this issue.
So much for a lookout on 2016, keep following us and keep wearing those gloves!
I’ve found this amazing video showing how “Merry Christmas and a Happy New Year” is said in sign language in English, Russian, Dutch, Chinese, Australian, Japanese, Finnish, Austrian, Hungarian, Swedish, French, American and German:
In the spirit of this video, let’s overcome all barriers! The whole Registrar Trek Team wishes you a merry Christmas and a happy, healthy and successful New Year 2016!
We collections professionals are a creative bunch. Because of our great passion, we do not let limited resources get in the way of our commitment to preserve our collections and make them accessible to our community. Tonnes of innovative ideas on how to store different types of objects are developed in museums, libraries and archives all the time. Sadly, these amazing ideas are rarely shared with the rest of the world. In your collection storage area, there are ideas that could benefit others who may be facing similar challenges as you.
If you work with collections, at some point, you have found solutions that you or your colleagues are particularly proud of, no matter how simple and modest it may be. You have found new ways to optimize space, to re-use existing materials and to make sensible use of resources. This is your opportunity to share your ideas with colleagues around the world and to learn from theirs.
Send us one or two photos of your storage solution with a short descriptive sentence that tells us:
The type of object
The materials used or re-used to create your storage solution
Why this system is better than before
There are several options for sharing your photos:
Here are some examples:
“We adapted a shelving unit to store our collection of oars and spears. We are able to use up less shelf space than before. We’ve gained more room for other objects.”
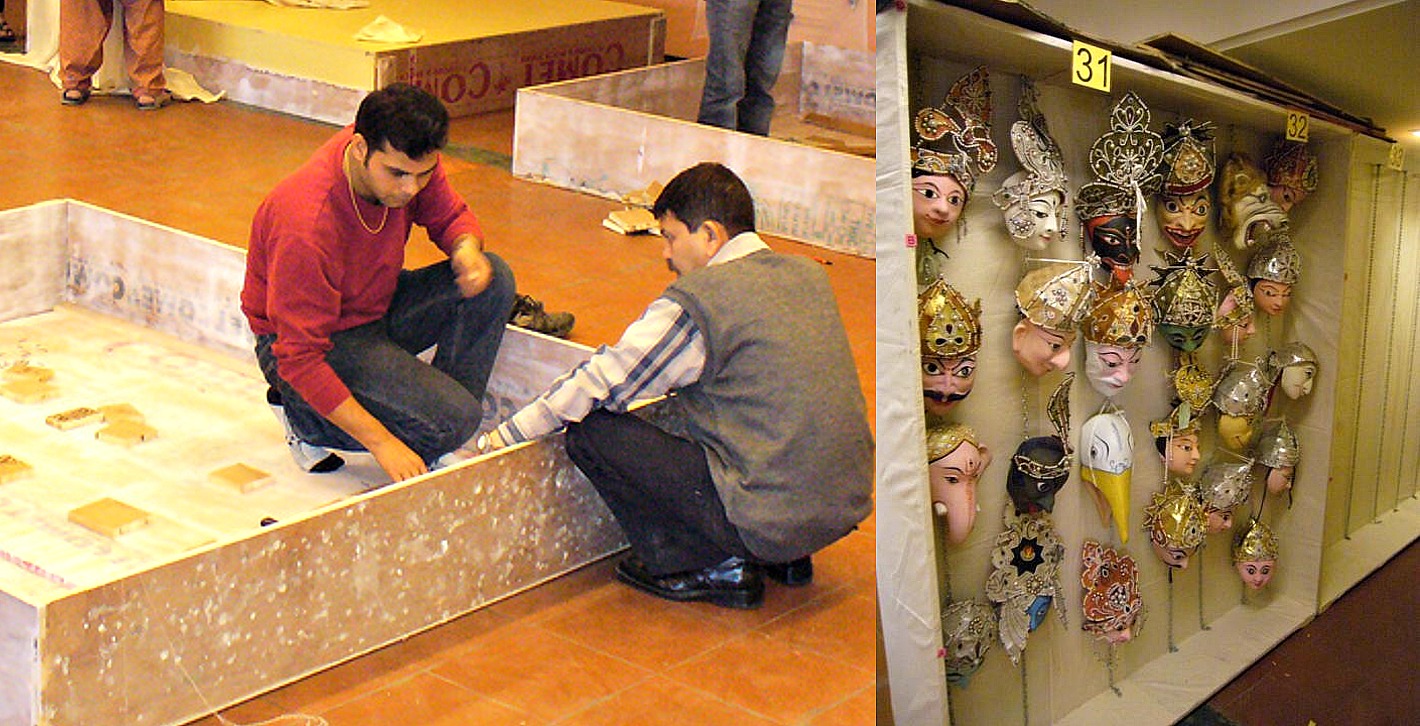
“We re-used large wooden crates. We fixed secured chains on the crates to hang the masks. Now they are off the floor, so we will no longer risk stepping on them.”
“We created compartments in a box with cardboard folded in zigzags. Now we can take each pen easily. Also, they don’t rub against each other.”


 This may seem a weird way to start an article written for registrars, but many years ago, I attended a day of clown school. It was a pretty unique experience, and (little did I know at the time) it was also an experience would turn out to have something in common with working as a registrar! Be you clown or registrar, the art of juggling is an important part of the job. For a registrar working with loans, for example, juggling is required to ensure that the demands of both the lender and their institution are satisfied to a standard that will enable the loan to proceed. When it comes to university museums, however, there is a whole extra level of complexity to these loan negotiations. University museums commonly undertake intra-institutional loans to all sorts of locations around their own university. Your items may still be ‘on-site’, but how much influence can you actually maintain over your loans in these circumstances? Juggling balls can all too quickly become chainsaws when you realise that there are many competing demands to manage in this environment, some of which are out of your control. The requirements of collections care and preservation, for example, can struggle to make themselves heard against the demands of institutional expectations, history and politics. Where do you draw the line on loan requirements in these circumstances? Is there, in fact, a line? Or is it a tightrope, perhaps? This was the very interesting subject which formed the basis for a fascinating session on the morning of Day 2 of the 2015 ARCS Conference in New Orleans.
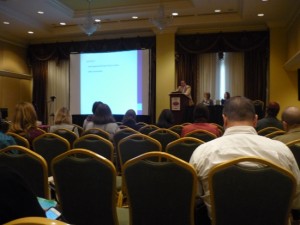
 Was it already a year ago we raised our glasses to celebrate the