I hope you enjoyed our little climate mystery. A lot of our readers did and submitted possible solutions. Two people came up with the right solution in this case:
Geert Bellens suspected immediately that the logger was brought into another room and was right about this place:
”If someone was breathing close to the logger, the temperature would rise at 16:30, but humidity also. If a heat source was involved (local heater, lamp,..) I would expect rising temperatures, and lower humidity, but no that drastically.
I would think someone took the datalogger to another room (warmer, dryer) and then maybe outside in the car for a night, to put it back the 3th September…?”
And Michael Hall did a complete analysis that was accurate to the point:
”I would suggest that the logger was actually removed from it’s original location. The changes in humidity are being driven by the changes in temperature. Looking at the conditions before and after the fluctuations the conditions are fairly stable. The sudden change in temperature could be caused by someone accidentally putting the logger into their bag that has come from a warmer environment, walked out of the building allowing the temperature to cool, then got in a car,driven home with the air con on, got home at about 17:30, the car is left in the evening sunlight allowing the car to warm up before the sun disappears giving a gradual cool down overnight. At 07:30 next morning, the person drives into work, realises they have taken the logger home and puts it back in situ.“
Although those were the right solutions in our case, there were other solutions that are well worth considering when YOUR logger shows an odd graph like ours:
Christian Baars: “The weather was mild during early September 2013, with daytime temperature at around 24 deg C. However, your T changes are too rapid to be caused by normal daily fluctuations. The RH changes in this case are counter correlated with your T changes, which suggests that something affected T but confirms you have no independent RH control. As you say there is no HVAC an equipment malfunction can be excluded. Something lead to the steady then rapid T increase, then slow drop during the night, followed by rapid normalisation of conditions. Do you have central heating in the building which came on, the store got too warm, someone opened a window in the evening of the 2nd which was left open over night then closed in the morning of the 3rd?”
Kathy Karkut: ”Potentially something was dropped over the data logger such as a box or bubble pack, etc. and the readings are for a very small contained space surrounding the DL. The next time someone was near the DL they removed the covering.“
Chris Au: ”My first avenue of inquiry would be to confirm the integrity of the datalogger; was the data compromised in its collection, interpretation, storage or transmission?
Secondly, was there any other evidence of the T and RH fluctuation?
Thirdly, what are the items in storage? Could anything there be a cause?
Perhaps there would be clues in those answers.“
Hugh Glover: ”A staff member did something dry as they left for home and undid it when they arrived in the morning; not sure what they did though!”
Paul McAuley: ”I agree with Kathy Karkut, something has fallen over the datalogger unit creating a microclimate – a sheet of bubble wrap or tissue – or some creature has interfered with the sensor – or maybe there is a ghost in the machine…”
Pat: ”There was marked solar flare activity from Sept 1 to Sept 3 2013. Could that have had anything to do with disrupting the datalogger readings?“
The most interesting alternative solution, and something I really hadn’t thought about so far came from Doug Nishimura. We take it for granted that we – or the building and our technical appliances – control the climate conditions. However, sometimes it’s the other way round. The objects control the climate:
”I was going to comment that the places where temperature and relative humidity go up or down together (at least briefly) looks like the objects controlling the conditions. We’ve seen this in a historic house in which the attic went up and down in temperature with day and night. In the day, temperature would rise accompanied sometimes by a small dip in RH followed by a sharp rise in RH before plunging. As temperature peaked and started dropping, we might see a little upward spike in RH but followed by a sharp drop in RH as temperature fell before rising back up. This was the wood in the attic releasing water vapor as temperature went up (off-setting the expected drop in RH as temperature rose) and the adsorption of water back into the wood as the temperature fell again. We more recently ran into in a warehouse full of ceramic pottery pieces from archaeological digs. The clay was also adsorbing water as temperature went down and releasing as the pottery pieces warmed up.
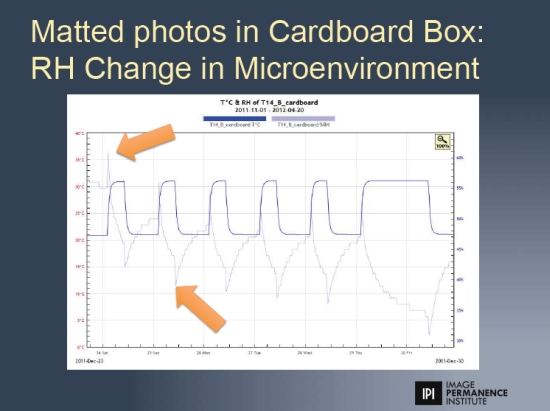
I’ve included a pdf slide of on an experiment my colleague, Jean-Louis, did with sensors in a box of matted photographs. He actually had a sensor inside the stack, inside the box on top of, or beside the stack and outside the box. The large arrows point out the first points that show the effect of the material on the RH inside the box. So you see as the temperature goes up, the humidity sharply follows it up before talking a long slower slide towards equilibrium. When the temperature goes down, we get a sharp drop in RH followed by the long slow slide towards equilibrium. As we poked into data that people uploaded to eClimateNotebook, we noticed this pattern appearing surprisingly often and we figured out that if you start from an empty room with non-hygroscopic walls, the environment is what it is. We start adding objects into the room and the room controls the objects. Eventually you reach a point where the ratio of hygroscopic materials to free air in the room is just high enough that the objects start to control the room. We don’t really see it so much in temperature, although I point out that a ream of common office copy paper (and American copy paper is 8.5 X 11 inches or 215.9 mm X 279.4 mm and one ream is 5 pounds or 2268 grams) takes the same amount of heat in or out to change one Celsius degree as 3.64 cubic meters of dry air. Possibly the effect doesn’t show-up because of the slow thermal conductivity of paper, but it’s an example of what can happen.“
Keep watching your climate data, folks!
This post is also available in Russian translated by Helena Tomashevskaya.
I accepted a request from members of the Island Church Foundation to serve as s Board Member and as an advisor to the Board. The Board is commited to establishing a climate controlled display space, including a work area and storage area in a building separate from Saint Wenceslaus Church.
The Board Also committed itself to search for students, who will be considered as equal to adults volunteers.
This is a huge committment from the Island Church Foundation for insuring the future if its heritage. The Bosrd is also working with the University of Wisconsin-Milwaukee in creating an Intern position with a stipend to assust with the cataloging the current collections of the Foundation.
This is an exciting time to work for the future of the Foundstion.
Hi Peter,
so glad to hear your institution is moving forward in collections care. This is a huge achievement. Congratulations!
Best wishes
Angela